Goals of this Lesson:
- Learn the basic commands:
c( ) ls( ) rm( ) mean( ) median( ) sd( ) summary( )
- Create a R script
-
- Use # to write comments
- Execute commands via a R script (extension .R)
-
Instructions
Watch the following video and do your R2 assignment. While the video demonstration below uses a Mac, both PC and Mac users will see a similar screen layout in R.
Here is the R2 assignment:
Very important!!!
Please follow the instructions below carefully as that’s how the grader grades your assignment. If you want a good grade, you should always double check your work a day or two after you finish it to make sure that you didn’t miss anything. Computer work is all about details!
-
- Create a R script to type your R commands for the three questions below.
- At the top of your R script, use # to type your name (it is optional to include other information such as assignment name, etc).
- For each question, use # to type the question number.
- Execute all the commands in your R script. Save the results as a .txt file just like you did in R1.
- Your .txt file should NOT contain any execution errors.
- Upload both your R script (the extension is .R) and the results file (extension is .txt )
-
- You can upload as many files to Canvas as you want as long as you have the correct file extensions. You can also upload as many times as you want. The grader will be able to see all the uploaded files (and different versions).
-
- Scroll to the bottom of this page to see what your .R script should look like.
Here are the 3 questions in this assignment:
1) Create an object (a vector) with the following properties:
-
-
- seven different numbers between 10 and 90 inclusively (that is, you can choose the number 10 or the number 90 if you wish)
- the mean is smaller than the median
- you can name the object (vector) anything you want
-
Show the summary. That is, use the summary( ) command. No need to use the mean() or median() command.
2) Create an object (a vector) with the following properties:
-
-
- seven different numbers between 10 and 90 inclusively
- the standard deviation of the seven numbers is between 10 to 14 inclusively (your standard deviation can be a decimal number e.g. 10.82 or 13.77 etc.)
- you can name the object (vector) anything you want
-
Show the standard deviation. That is, use the sd( ) command.
Hint:
Instead of randomly trying a bunch of numbers, a more efficient way is to understand what a standard deviation means and then try numbers that will more likely to get you the results.
Recall that a standard deviation = the average deviation of all observations from the mean. Take a look at Fig 2.3 on p50. In that example, the standard deviation of 189.24 lies between the smallest (14) and the largest deviation (267). See also #24 in Ch 2 multiple choice.
3) Create an object (a vector) with the following properties:
-
-
- seven different numbers between 10 and 90 inclusively
- the standard deviation of the seven numbers is between 2 to 4 inclusively
- you can name the object (vector) anything you want
-
Show the standard deviation.
Here is what your .R script should look like:
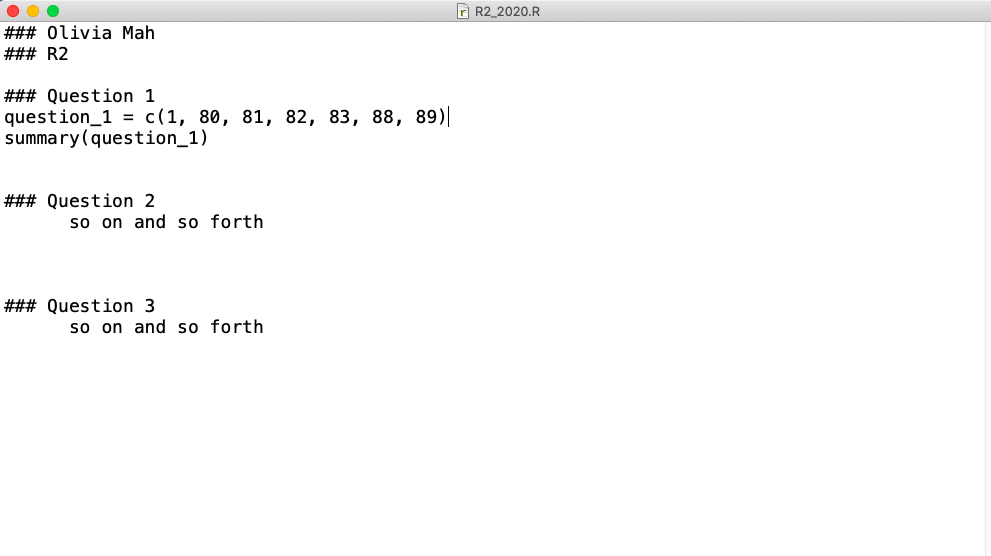
Note: For some of you, you might see a bunch of text displayed on the screen after your three arithmatic operations. That’s fine. Just leave it there. See irrevelant_text.
-END-