Physical History
Resource Bubbles
By Administrator
First published on May 17, 2019. Last updated on February 6, 2021.
Introduction
Rise-fall nonrenewable resource consumption functions (“curves”) are examples of resource “bubbles”. M. King Hubbert’s modeling of Peak Oil is the most famous example of a resource bubble. However, that case was inspired by the earlier work of Donnel Foster Hewett regarding regional metal mining.
The essence of a bubble is a build up of potential that then gets relieved. The key is that there is a critical resource that is not renewable. Any amount that gets consumed cannot get replaced. Once that resource is consumed, it is gone forever. So production must eventually end.
Deposits of gold are an example that represent built-up potential. Usually achievement (consumption) of the potential begins slowly, but then grows exponentially. Hence production will grow quickly, but intrinsic efficiency begins to drop, impacting production. Eventually efficiency will drop below the level at which achievement can be obtained, or the entire potential will be consumed, and the bubble ends.
Regional Example—San Juan Mining Region
To apply bubble analysis, the region considered must be sufficiently large enough to initially support many mines. The San Juans region in Colorado is such a region, and is a suitable example of a single historical regime is the mining society that developed in the San Juan mining region. Since precious metals tend to be a nonrenewable resource, they can be said to be conserved (that only a fixed amount of the resource ever will exist) for a given region. In other words:
Potential consumption + cumulative production = constant
at any point of time. Potential consumption equals that constant before exploitation begins.
The San Juan mining region of Colorado produced gold and silver from dozens of mines, around which towns and communities eventually developed. Mining began as early as 1765. Its heydays were between about 1889 and 1900. There is again mining in miscellaneous minerals, but the not much in gold, which was the primary economic driver for the “great days”. The region is now used primarily for recreation and some agriculture. (Smith, 1982)
Spanish gold mining of placer deposits took place between about 1765-1776 (native pieces of nearly pure gold found on the surface). Some mining took place in 1860, but it was interrupted by U.S. Civil War. At this point, “only the smaller deposits of high-grade ore could be mined profitably.” Mining slowly started again in 1869. There were 200 miners by 1870. An Indian Treaty was negotiated in 1873, which removed a major obstacle to an increase of mining. (Smith, 1982)
By 1880 there was nationally a “surplus of silver; pressures to lower wages; labor troubles.” In 1881 a railroad service was established, resulting in a “decline in ore shipping rates.” By 1889, $1 million[1] in gold and silver were being produced each year (for one particular sub-region). Around 1889, English investors had come to control the major mines by this time. The 1890 production total for San Juans was $1,120,000 in gold; $5,176,000 in silver. The region produced saw $4,325,000 in gold and $5,377,000 in silver in 1899. (Smith, 1982)
By 1900, the region began to take on more of the characteristics of a settled community. There was a movement for more “God” and less “red lights.” By 1909, “the gilt had eroded” (dilapidation set in; decreasing population). In 1914, production greatly fell, due to decreased demand from Europe (because of World War I) and the region lost workers. Farming becomes more important to local economy than mining. Recreation and tourism revenues become the only bright spot for many mining towns. Silver and gold mining all but ceased by about 1921. (Smith, 1982)
Here, the end of mining has a fairly clear cut-off date. However, the beginning of mining seems to have stretched out over a longer period of time, during which mining levels were quite small. [The curve was previously modeled using a Maxwell-Boltzmann distribution, but this was a more empirical approach. Originally, only a few data points were readily available (Smith, 1982), but digitization of sources, even if just scans, has made much more data available.]
Deviations will be shown in the curve occurred to both random events, social, economic and logistic “turbulence”, business cycles and major external events such as the U.S. Civil War.

Colorado San Juans gold production versus model
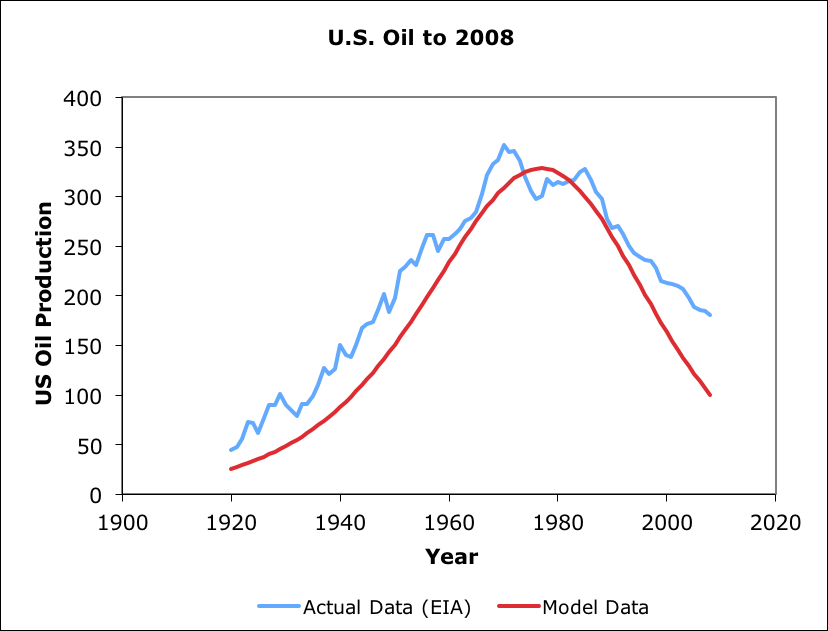
A EDEG model was created (in 2010) for U.S. domestic petroleum extraction (see below). Actual data exceeds model prior and after peak. Parameters were set to match peak, but could have beed adjusted to for less error elsewhere at the expense of greater peak error. This model used a older version of EDEG than the most recent San Juans model, so the overall plot is not as well matched.

EDEG model for US petroleum production up to 2008.
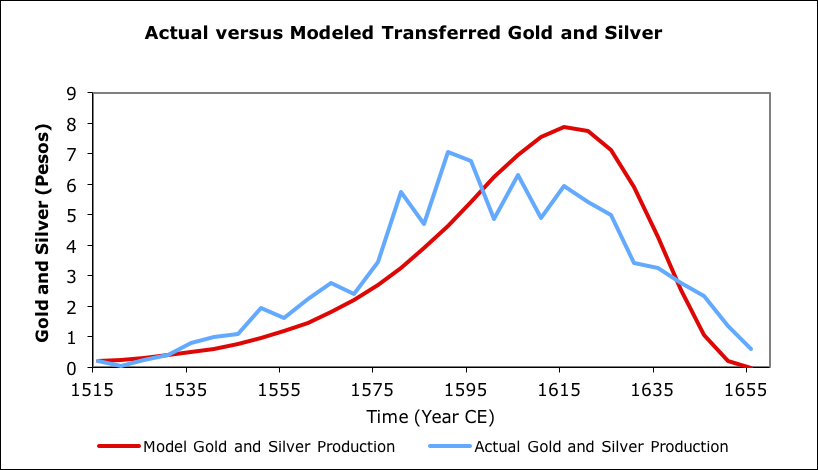
Another example, on a multi-continental basis was gold and silver production in areas of the Americas controlled by Spain, primarily during the Habsburg dynasty. An EDEG model was produced for that period. This model used a cruder version of EDEG than the most recent San Juans model, so the peak is not as well matched.

Silver and gold exports from New World versus model (data from Gibson, 1996)
References
Ciotola, M. 1997. San Juan Mining Region Case Study: Application of Maxwell-Boltzmann Distribution Function. Journal of Physical History and Economics 1.
Ciotola, M. 2001. Factors Affecting Calculation of L, edited by S. Kingsley and R. Bhathal. Conference Proceedings, International Society for Optical Engineering (SPIE) Vol. 4273.
Ciotola, M. 2003. Physical History and Economics. San Francisco: Pavilion Press.
Ciotola, M. 2009. Physical History and Economics, 2nd Edition. San Francisco: Pavilion of Research & Commerce.
Ciotola, M. 2010. Modeling US Petroleum Production Using Standard and Discounted Exponential Growth Approaches.
Gibson, C., Spain in America. Harper and Row, 1966.
Hewett, D. F. 1929. Cycles in Metal Production, Technical Publication 183. New York: The American Institute of Mining and Metallurgical Engineers.
M. King Hubbert. 1956. Nuclear Energy And The Fossil Fuels. Houston, TX: Shell Development Company, Publication 95.
Hubbert, M. K. 1980. “Techniques of Prediction as Applied to the Production of Oil and Gas.” Presented to a symposium of the U.S. Department of Commerce, Washington, D.C., June 18-20.
Mazour, A. G., and J. M. Peoples. 1975. Men and Nations, A World History, 3rd Ed. New York: Harcourt, Brace, Jovanovich.
Smith, D. A. 1982. Song of the Drill and Hammer: The Colorado San Juans, 1860–1914. Colorado School of Mines Press.
U.S. Energy Information Administration