Physical History
The Colossus Model of World History
By Mark Ciotola
First published on May 17, 2019. Last updated on January 19, 2021.
Colossus is a computer-based simulator that generates models of world history. It utilizes a grid of dynasty-producing regions and interconnections between neighbors. This model focuses on the “old world” of Asia, Europe and Africa before World War I.
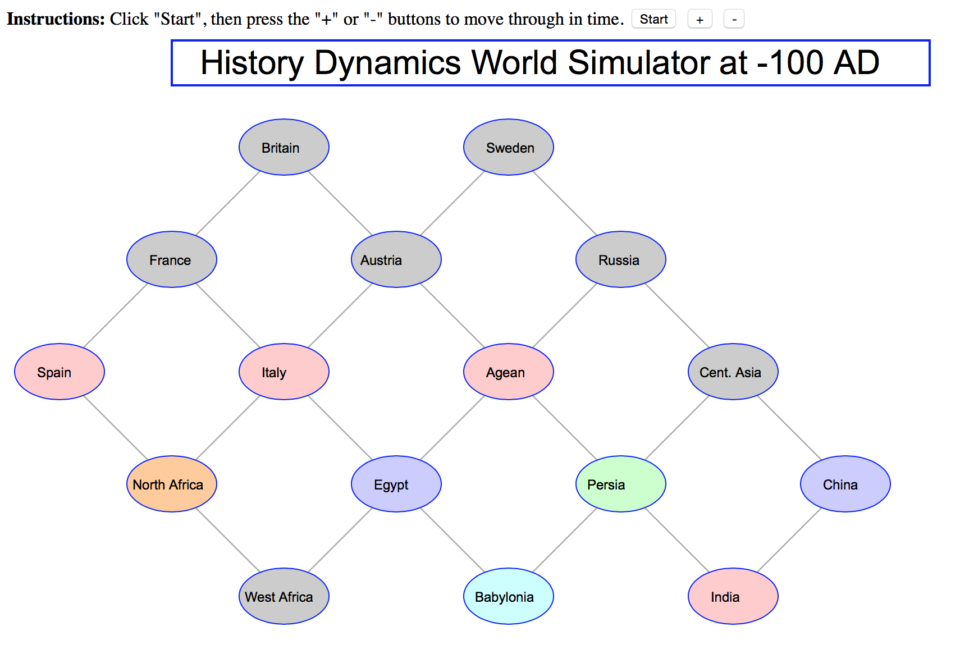
History grid (PHP/SVG)
A newer version coded in the D3 Javascript library, with a button for each century:
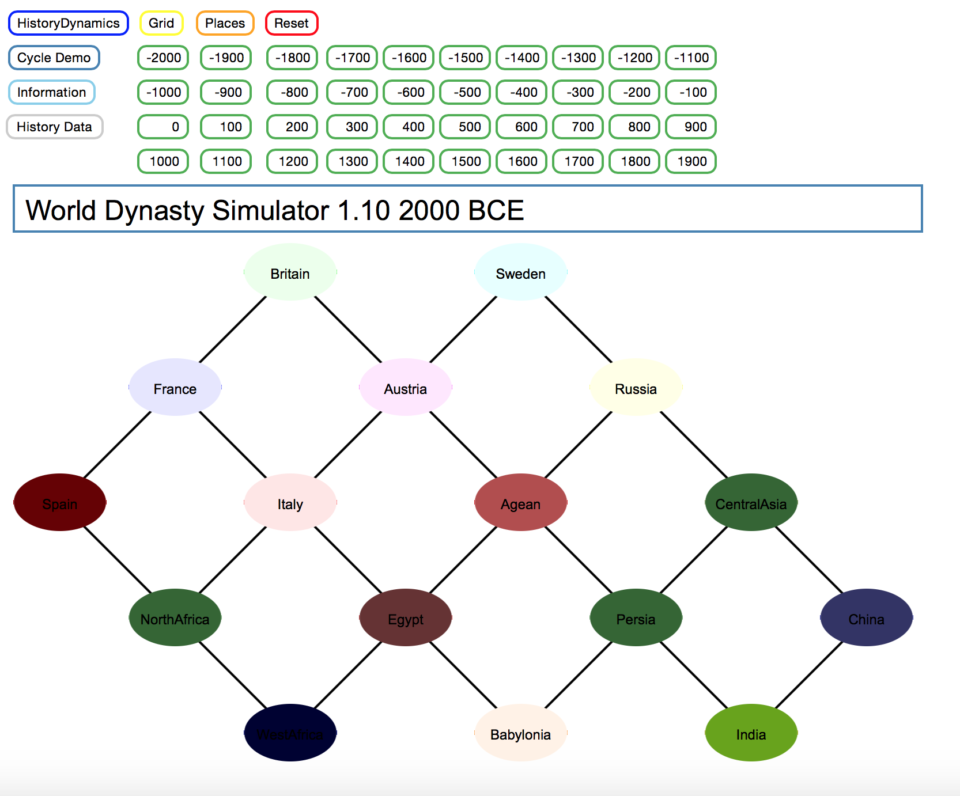
History grid (D3)
The Colossus simulator itself is written in the Ruby programming language, and results are exported as a CSV file. Sample output is below. Each row is a time period indicated by a year. The left bank of columns represent power. The right bank of columns represent power differenced between regions. This is an exploratory simulation. It has many deficiencies.
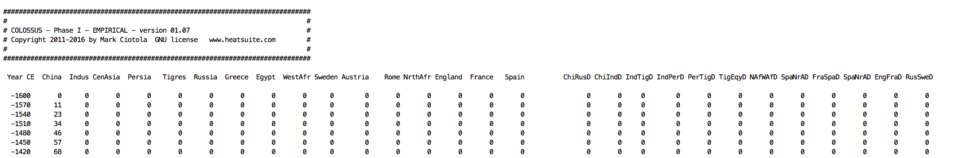
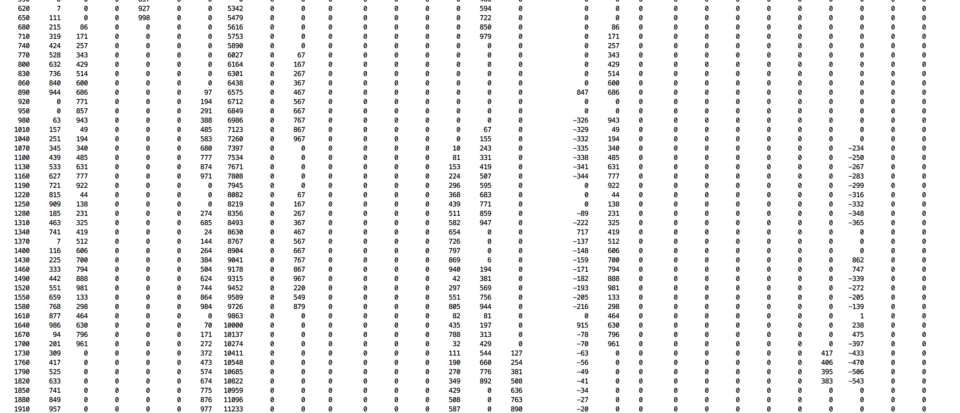
Colossus simulation output
An early example of graphical representation of output. It is not very meaningful.
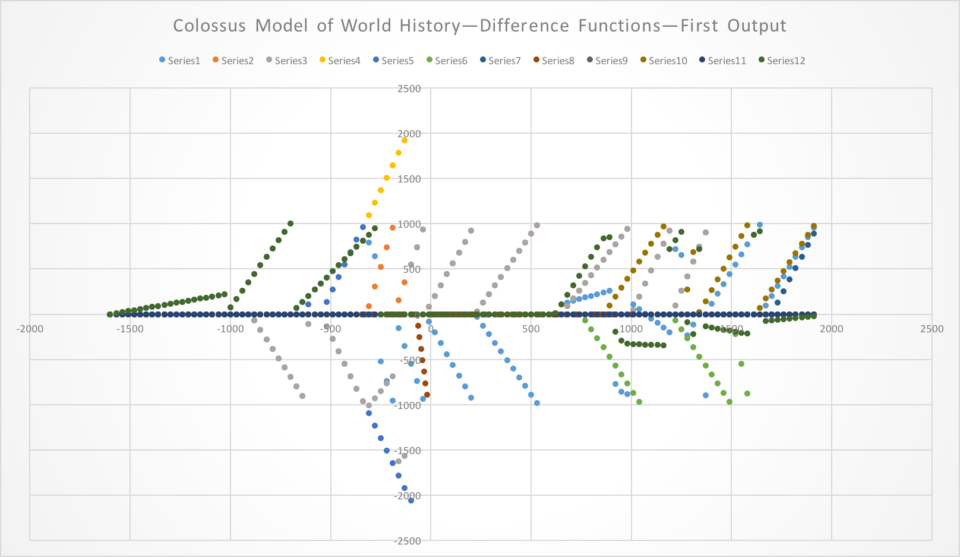
Early graphical representation of Colossus results
« Interrelations Between Concurrent Dynasties | COURSE | A GIS Approach to World History »