Economics for Engineers
Supply and Demand
By Administrator
First published on April 17, 2021. Last updated on April 17, 2021.
Fourier’s Law of Conduction
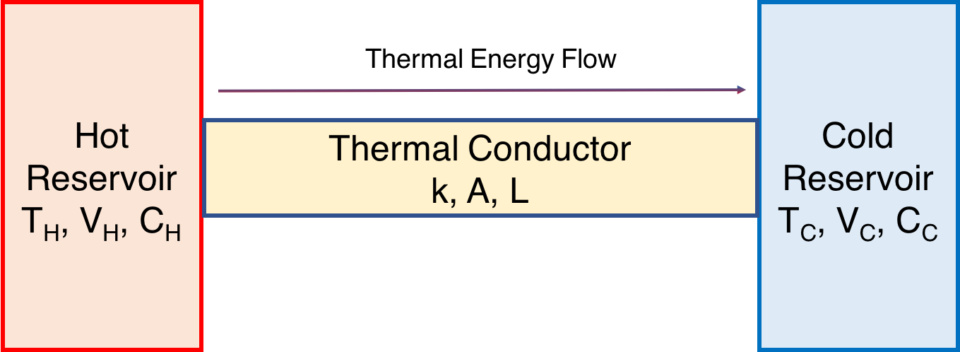
It is well known that thermal energy (heat) flows from hot to cold. Fourier’s Law of Conduction expresses this relation in a simple and precise manner for a thermal conductor bridging hot and cold reservoirs.
Let us consider a thermal conductor bridging large reservoirs, whose temperatures remain constant. For example the conductor could be a bar of metal. The hot reservoir has plenty of thermal energy to spare, and the cold reservoir wants that energy!
You might point out that such thermal reservoirs have many important characteristics such as volume and specific heat capacity, but here we will simplify matters and assume that both reservoirs are so large that their temperatures never change and that there are no phase changes. Only their temperatures differ, the hot reservoir being at 300 and 500 “degrees” Kelvin (actually a unit just called Kelvin (K) with is similar to degrees). So the temperature difference is 200 K.

This can be expressed via the following equation:
\(\frac{\Delta Q}{\Delta t} = \frac{k A}{L}(T_H – T_C)\),
where Q is thermal energy flow, t is time, A is conductor area, L is conductor length, TH is hot reservoir temperature, and TC is cold reservoir temperature.
Let’s examine the implications of this set-up. As time passes, a certain amount of thermal energy flows from the hot to the cold reservoir. Thermal energy flows faster through conductors with larger surface areas and slower through longer conductors. Even more significant for our purposes is that thermal energy flows faster for larger temperature differences.
In summary, even though a lot of thermal energy could flow through the thermal reservoir, only so much does so per unit of time, due to the constraints from each part of the system.
Application to Economic Transactions and Markets
Supply and Demand theory models at which prices consumers will purchase a product, at what prices will producers sell a product, and the resulting market price for the product. Supply and demand provides a framework for understanding pricing and sales volume. Although real life pricing sometimes deviates from this idealized theory, the Supply and Demand approach can help identify why those deviations exist.
Supply Function
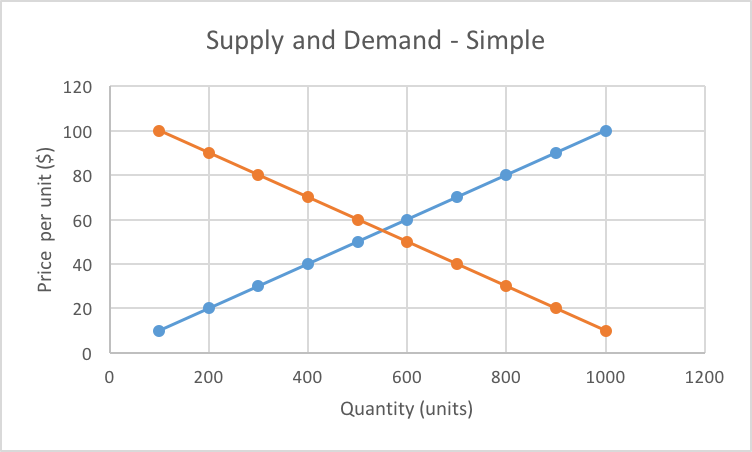
The supply function is the price at which producers will sell a product as a function of quantity sold. According to theory, producers will demand a higher price for each additional unit of product sold, due to increasing marginal costs. Let’s use gold as an example. Each additional unit of gold mined requires gold producers to mine more deeply into the ground (or use lower grade ore), which is more expensive. In summary, suppliers tend to charge more money per additional unit supplied, at least in the short run.
How quantity supplied varies with price paid is called the Supply Function.
Demand Function
The demand function is the price at which consumers will buy a product as a function of quantity purchased. According to theory, consumers will only pay a lower price for each additional unit of product purchased, due to a decreasing marginal utility. (Utility means the value the the product to consumers). Continuing with gold as an example, consumers only really need a small amount of gold. They might be willing to pay all their savings for gold engagement jewelry. They might still be willing to pay a lot of money per gram for additional gold jewelry. Beyond that, most people do not have a high need or desire for more gold, and would not be willing to pay as much for more of it.
How quantity demanded varies with price paid is called the Demand Function.
Determining the Market Price
These Supple and Demand functions can be plotted, with the axes being price and quantity. Where these two functions intersect indicates both market price and quantity produced. The plots shown are simplified examples. Actual plots may vary.

Market price and quantity are where supply and demand functions meet to determine market price.